tóng-àn:Greenhouse Gas by Sector.png

Seng khoàⁿ chiàm-liōng: 600 × 600 siōng-sò͘. Kî-thaⁿ--ê kái-sek-tō͘: 240 × 240 siōng-sò͘ | 480 × 480 siōng-sò͘ | 768 × 768 siōng-sò͘ | 1,024 × 1,024 siōng-sò͘ | 1,632 × 1,632 siōng-sò͘.
Choân kái-sek-tō͘ (1,632 × 1,632 siōng-sò͘ , tóng-àn chiàm-liōng: 366 KB, MIME luī-hêng: image/png)
Tóng-àn le̍k-sú
Chhi̍h ji̍t-kî/sî-kan, khoàⁿ hit sî-chūn--ê tóng-àn.
| Ji̍t-kî/Sî-kan | 細張圖 | 寸尺 | Iōng-chiá | Chù-kái | |
|---|---|---|---|---|---|
| hiān-chāi | 2019-nî 3-goe̍h 14-ji̍t (pài-sì) 07:42 |  | 1,632 × 1,632(366 KB) | Dragons flight | Some suggested tweaks in category labels |
| 2019-nî 3-goe̍h 13-ji̍t (pài-saⁿ) 12:04 |  | 1,632 × 1,632(366 KB) | Dragons flight | Updates diagram to use the EDGAR 4.2 FT2010 values for the year 2010 | |
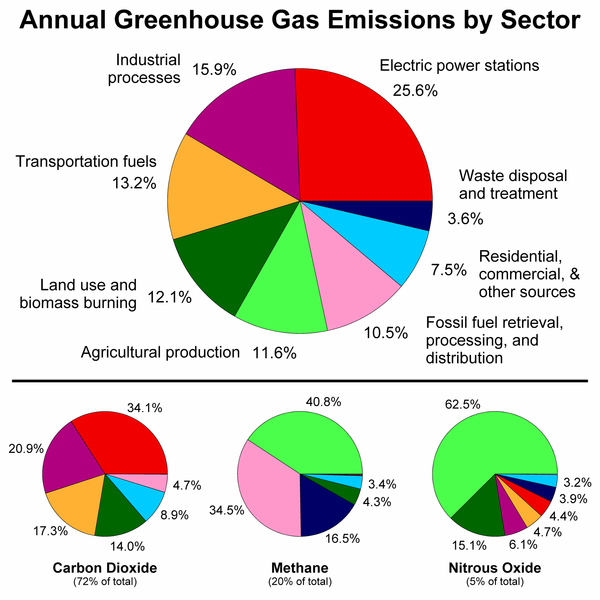
| 2006-nî 11-goe̍h 23-ji̍t (pài-sì) 17:36 |  | 650 × 603(33 KB) | Xiaowei | == Description == This figure shows the relative fraction of man-made greenhouse gases coming from each of eight categories of sources, as estimated by the Emission Database for Global Atmospheric Research version 3.2, fast track 2000 project [ht |
Iáⁿ-siōng liân-kiat
Í-hā ê ia̍h liân kàu chit ê iáⁿ-siōng:
tóng-àn hō͘ lâng sái--ê chōng-hóng
Ē-kha--ê kî-thaⁿ wiki ēng tio̍h chit--ê tóng-àn:
- ar.wikipedia.org hō͘ lâng ēng--ê chêng-hêng
- de.wikipedia.org hō͘ lâng ēng--ê chêng-hêng
- en.wikipedia.org hō͘ lâng ēng--ê chêng-hêng
- fa.wikipedia.org hō͘ lâng ēng--ê chêng-hêng
- fr.wikipedia.org hō͘ lâng ēng--ê chêng-hêng
- ga.wikipedia.org hō͘ lâng ēng--ê chêng-hêng
- gu.wikipedia.org hō͘ lâng ēng--ê chêng-hêng
- hi.wikipedia.org hō͘ lâng ēng--ê chêng-hêng
- hr.wikipedia.org hō͘ lâng ēng--ê chêng-hêng
- hu.wikipedia.org hō͘ lâng ēng--ê chêng-hêng
- ja.wikipedia.org hō͘ lâng ēng--ê chêng-hêng
- kn.wikipedia.org hō͘ lâng ēng--ê chêng-hêng
- ko.wikipedia.org hō͘ lâng ēng--ê chêng-hêng
- nl.wikipedia.org hō͘ lâng ēng--ê chêng-hêng
- sh.wikipedia.org hō͘ lâng ēng--ê chêng-hêng
- sl.wikipedia.org hō͘ lâng ēng--ê chêng-hêng
- sq.wikipedia.org hō͘ lâng ēng--ê chêng-hêng
- ta.wikipedia.org hō͘ lâng ēng--ê chêng-hêng
- th.wikipedia.org hō͘ lâng ēng--ê chêng-hêng
- vi.wikipedia.org hō͘ lâng ēng--ê chêng-hêng
- zh.wikipedia.org hō͘ lâng ēng--ê chêng-hêng


